.svg)

You invest a good few hours into writing and designing your NPS survey, carefully picking the questions and wording them just how you want them.
When you’re finally done, you choose who to send it to and fire it off, crossing your fingers for positive responses. Then you wait…
…And you wait, and you wait some more. Hardly anyone fills it out. Why did this happen?
When sending out surveys, most companies worry about being inundated with reports of bad customer experiences. Despite your service team’s best efforts, the post-purchase part of the customer journey is always a blind spot unless the customer reaches out again or reconverts.
But behind the unpleasant possibility of negative responses from customers lies a potentially more disappointing outcome: A lack of responses altogether. If only a very small subset of your customer base responds, whether they report a good, bad, or neutral experience, you can’t do much with that data.
How can you structure your surveys to get a higher rate of good-quality responses, so your survey results actually reflect the general sentiment of your customer base? What is a good survey response rate to aim for? What’s a good NPS score? And what are some reasons why your surveys may not be performing as expected? Let’s dive in.
Jump to:
What is a good survey response rate?
Why is survey response rate and quality important?
How to improve survey response rate
Why do I have a low survey response rate?
Why is NPS score important?
How to get the most accurate picture of customer sentiment
What is a good survey response rate?
When it comes to survey response rates, there is no one number everyone should shoot for; your NPS response rate goals should be based on your industry, audience, and survey delivery method. Survey response rate benchmarks can vary depending on who you ask and where you look, and are influenced by a number of factors, so it’s best to view your benchmark as a range or a minimum percentage to hit.
Also, it’s important to keep in mind that response rate alone doesn’t fully reflect the quality of survey data. Surveys are meant to gauge insights from your customer base in its entirety, so responses should be representative of your customer demographics. More on that in a minute.
According to CustomerGauge, the average NPS survey response rate for B2B brands is 12.4%, but rates can vary anywhere between 4.5% and 39.3%. And Delighted, a feedback program by Qualtrics, has reported that companies sending out NPS surveys should look to hit a response rate of at least 20%. The average survey response rate - for all surveys, not just NPS surveys - reported by Delighted users ranges between 6-16% depending on the survey channel.
Factors to consider when setting a NPS survey response rate benchmark include:
- Survey delivery method. Email surveys and SMS surveys tend to perform better than website or in-app surveys.
- Your target audience. Younger people (those who are less than 65 years old) may be more likely to respond to online surveys than older groups.
- Whether the survey is internal to the company or external. Internal surveys tend to have much higher response rates.
- B2B vs. B2C. B2B response rates may be generally higher than B2C, but this is likely due to the fact that B2C surveys tend to have larger sample sizes.
- The size of your audience. If you’re surveying a large group of people, your response rate may be a bit lower than if you had a smaller sample size. You may be trying to reach as many people as possible, but as we’ll get into later, a larger sample size may not always be better.
- Your industry. Customers may be more likely to engage with some industries more than others.
Why is survey response rate and quality important?
Most of the time, a low number of survey responses relative to the number of sends means the data is less accurate. The point of surveys is to use a smaller group to represent the opinions of a larger one - i.e., your entire customer base or a significant subset of it. Few responses mean the data may not be statistically valid.
The lower your response rate, the higher your margin of error will be. Simply put, a margin of error represents how closely your survey results reflect the views of your customer base as a whole, and offers a range for how much your calculations may differ from reality.
Without getting too into the weeds with statistical formulas, the margin of error is calculated using:
- Your confidence level - How confident you are that the data accurately reflects the opinion of the customer base. This is usually set at 95%, and is represented in the calculation by a value known as a z-score.
- Standard deviation - How dispersed the range of values in your data is, or how much the highest and lowest ends of your full dataset deviates from the average.
- Sample size - The number of people who have completed your survey.
A small sample size relative to your audience size is unlikely to be representative of your entire customer base, so your margin of error will have to be larger.
The following is the formula for calculating margin of error:
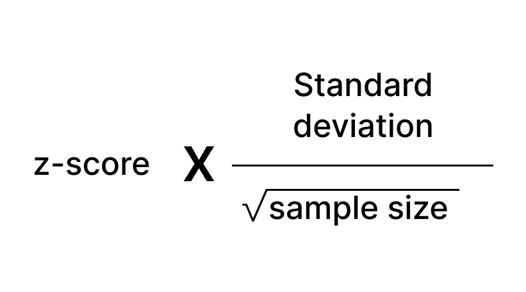 If you’re looking to find out whether your sample size will provide a sufficiently low margin of error but would rather not manually calculate it, you can input your information into a margin of error calculator.
Misleading data isn’t helpful, whether it’s positively or negatively skewed. Usually, the first people to complete surveys for businesses are the ones that are either extremely thrilled or very dissatisfied with their experience. In fact, NPS surveys with low response rates tend to paint a rose-tinted picture. Whenever we have sent out NPS surveys for clients, we’ve generally found that in the first few hours of responses, the NPS score is nearly perfect, but as time progresses and more people complete the survey, the score actually goes down somewhat.
A perfect NPS score may be flattering, but the vast majority of the time it’s not accurate, so it’s best to understand how your audience is actually feeling.
Beyond just size, it also matters whether or not your survey respondents are representative of your customer base in terms of their characteristics. For example, if 70% of your customer base uses iPhones and 30% use Androids, but your survey has 60% Android users, your results are likely biased.
So if your surveys are underperforming, or you feel you aren’t getting results that represent your whole customer base, how do you go about improving survey response rate and quality?
How can you improve survey response rate and quality?
Survey response rate and quality are tied together, but a high response rate doesn’t always mean you’re working with the best possible data. Still, the higher the response rate, the better.
Common logic may suggest that to get more responses, the best course of action is to send the survey to as many people as possible, but that’s not necessarily true. The responses that matter most are ones from your most profitable (or potentially profitable) customers.
To get accurate survey results, companies often segment their customer base according to the characteristics of their highest-value, most profitable customers. This way, they can understand their performance amongst their highest-value customers, without the responses being drowned out by those that are less profitable or are less likely to become repeat customers.
It can be challenging to figure out how to segment your customer base, but it’s important to consider the following:
- Demographics of your ideal customer profile
- Type of product or service purchased
- How much they’ve spent on your products/services thus far
- Customer persona; are they the decision-maker?
To improve survey response rate, try out some of the following strategies:
- Consistently survey your customers. Keep the data flowing. According to Bain & Company, the inventors of the NPS score itself, many leading companies survey a portion of their customer base each week, and nearly all report on survey data at least every month. It’s better to send fewer surveys on a more frequent basis than periodically bulk-send surveys every 6 months or every year.
- Send surveys through the channel that your customers respond to the most. Feel free to experiment with different survey channels, whether that’s SMS, email, or pop-up web surveys.
- Send targeted surveys to different customer segments. With personalized survey questions that are relevant to each subset of your customer base, you may be able to boost your response rate.
- Ensure your survey isn’t too long. Keep it short and sweet. According to HubSpot, most consumers are willing to spend a maximum of 10-14 minutes on a survey, and answer no more than 7-10 questions at a time. You may experience a low response rate if your survey length exceeds these limits.
- Don’t ask any unnecessarily intrusive or irrelevant questions. If you’re asking a customer to review a bar of soap they purchased, and there’s a question in your survey about household income, the customer is probably going to flee.
- Allow for multiple ways to complete the survey. Make sure any web-based survey you create is mobile-optimized so your customers don’t have to open up their laptop to complete it. It’s best to remove as many barriers to response submission as possible.
- Use a catchy email subject line, if you’re delivering your survey through email.
- Send surveys in response to customer action, rather than out of the blue. While relational NPS surveys, which evaluate the overall relationship you have with your customers, have their place, customers tend to engage a bit more with transactional NPS surveys, which are sent after specific customer touchpoints, since the customer has very recently interacted with your company.
What does a low survey response rate mean?
So you’ve followed some of the best practices above; your survey is short, your questions are carefully crafted to be hyper-relevant, and the channel works for your customers, but you’re still not getting the results you want. Maybe your survey needs more fine-tuning, but could a low response rate point to a bigger issue?
Here are some potential problems to be on the lookout for if your surveys consistently receive low response rates.
- Your email health score is low. If you frequently (multiple times a week, or even a day) send generic promotional emails to a large portion of your customer base, this may result in a number of people unsubscribing from your emails or even reporting them as spam. Too many spam reports can lead to your emails being hidden in the “Promotions” folder of some email clients, or even sent right to the spam folder. Personalization and contact segmentation is key to maintaining email health.
- Your customer data is outdated or incomplete. If you’re attempting to send personalized emails to customer segments, but are working with inaccurate data, your surveys won’t reach the right people.
- Your survey UI is dull or otherwise unappealing. A web survey page that looks like a plain HTML website from the 1990s won’t do you any favors.
- Your customers are burnt out on surveys. I know we said consistency is key, but there’s a line between consistent and excessive, and if you cross it, your customers will lose interest.
- You don’t follow up with customers who have had a bad experience. To maintain your company’s positive reputation, your service team should be prepared to follow up with customers who report having had a negative experience. Even if you’re not able to convince them to come back, if you work to resolve the issue to the best of your ability, they’re much less likely to become detractors who actively speak negatively of your company.
- Your customer experience may be lacking. If your customers are generally unengaged with your business, they may not be motivated to leave a review. To find out if this might be the case, take a look at your churn rate. Are the majority of your customers new or existing? Churn doesn’t always occur because of an overtly negative experience - but rather because of a lack of re engagement strategies to keep customers in the loop.
Why is NPS Score an important metric?
NPS score is one of several survey metrics that can be used to assess how customers feel about your brand. NPS differs from other industry-standard metrics like customer satisfaction (CSAT) score because NPS helps you understand whether your customers are happy enough to actively promote your brand to others - or, on the flip side, if they’re unhappy enough to complain to others.
It’s important to give customers an opportunity to express their opinion directly to you. Research shows that only 1 in 25 unhappy customers will take the initiative to complain to you, and an overwhelming majority of those that don’t complain (91%) will silently churn. Without regular surveys, you won’t be able to find out what’s driving customer churn.
The best, most reliable new business comes from referrals, which is why a high NPS score is something to shoot for. In the majority of cases, a “good” NPS Score is anything above 0, a “favorable” score is above 20, and a great NPS score is 50+. This does depend on industry benchmarks, however. Industry standards for NPS scores vary widely; for example, while software industry benchmarks range from 18 on the low end to 44 on the high end, internet service provider benchmarks range from -16 - 19. Big difference.
NPS surveys can give you an idea of how your customers are feeling, and whether you can expect new business to come in as a result of delighting your current customers.
How can you get the most accurate picture of customer sentiment?
Though NPS score offers a window into customer sentiment, it’s best not to rely solely on that metric. NPS surveys can be used as a part of your customer satisfaction strategy, which may also include other types of surveys like CSAT. Metrics that help determine customer satisfaction besides NPS and CSAT include:
- Churn rate
- YoY sales
- Customer retention rate
Surveys help close the “feedback loop” of the customer journey, and fill in post-purchase blind spots in data. To learn more about the benefits of surveys, and how they’re more effective at helping you gauge customer sentiment than public customer reviews, read our blog post on customer feedback.


.svg)